Greens would have won seven council seats under proportional representation
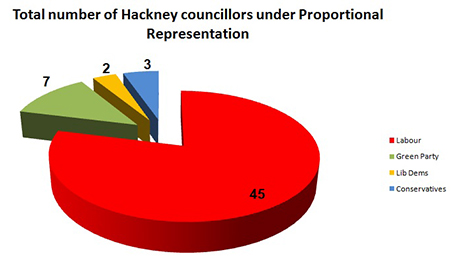
Slice of the pie: this chart shows how many councillors each party would have gained under proportional representation. Image: Emmanuel Mair
No Green councillors were elected despite the party coming second in 17 out of 21 wards and in the mayoral election.
The Hackney Citizen estimates that if the proportional representation system used in the European elections was employed in local elections, the Greens would now have seven councillors in Hackney, making them by far the largest opposition party locally.
Our estimate relies on the average (mean) number of votes won by each party by ward (see below for further explanation of our calculations).
A spokesperson for the party said: “The Green Party garnered 20.5 per cent of the vote in the borough, more than the Lib Dems and Tories combined – yet these parties are represented on the council and we are not. This is due to the UK’s frankly antiquated first past the post system.”
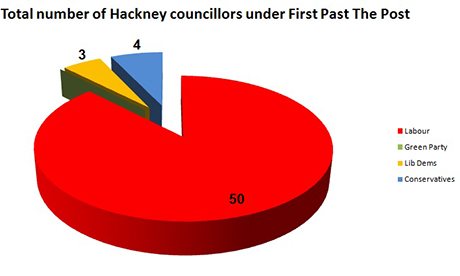
None of the pie: the situation under first past the post. Image: Emmanuel Mair
First past the post, which is used in local elections and general elections, allocates seats to candidates who receive the most votes.
Proportional representation, by contrast, endeavours to reward parties who have not come first but still received a significant share of the vote by giving them a minority share of seats.
Under proportional representation the Greens are highly likely to have taken one of Labour’s seats in each of Clissold, Dalston, Hackney Central, Hackney Downs, Lea Bridge, London Fields and Stoke Newington wards.
The Liberal Democrats would have lost one of three seats to Labour in Cazenove. The same fate would have befallen the Conservatives in Springfield ward.
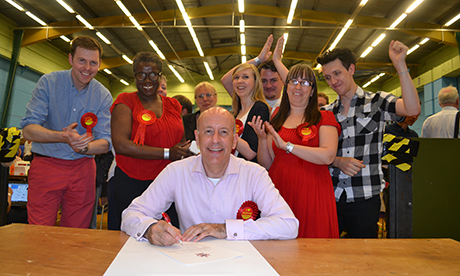
Jubilation: Labour Party activists and newly elected councillors celebrate at the Britannia Leisure Centre count on Friday. Photograph: Josh Loeb
These predictions amount to approximations since there no way of calculating with absolute certainty the result under proportional representation because of the differences between this system and first past the post. However, we think the method we have used is viable since in most wards candidates from the same political party received similar numbers of votes.
As things stood the Liberal Democrats held onto their three seats in Cazenove ward, and the Conservatives remain the main opposition with four seats.
In Lea Bridge and Stamford Hill West wards the Conservatives’ Linda Kelly – the party’s mayoral candidate – and Bernard Aussenberg lost their respective seats.
How we did our research
Our analysis was based around the so-called D’Hondt system of proportional representation.
To do the calculation we needed to know the number of votes received by each party. However, in the local elections voters elected specific candidates rather than voting for particular parties per se.
To get around this problem, for each ward we took the mean average of all candidates by party. From this we were able to apply the D’Hondt method.
Example
The following are the results from Cazenove ward, followed by an illustration of the process we used to calculate numbers of seats under proportional representation.
| Candidate | Party | Votes |
| Abraham Jacobson (elected) | Liberal Democrats | 1,731 |
| Dawood Ebrahim Akhoon (elected) | Liberal Democrats | 1,715 |
| Ian David Sharer (elected) | Liberal Democrats | 1,709 |
| Kofo Adeolu-David | Labour Party | 1,688 |
| Gilbert Smyth | Labour Party | 1,602 |
| Matthew Burn | Labour Party | 1,593 |
| Mischa Borris | Green Party | 744 |
| Jenny Lopez | Green Party | 580 |
| Teresa Webb | Green Party | 538 |
| Marzena Iwona Kwasnik | Conservative Party | 209 |
| Pamela Yvonne Sills | Conservative Party | 189 |
| Erika Halasz | Conservative Party | 150 |
We worked out the mean number of votes for candidates representing the same party:
| Party | Average votes per candidate |
| Lib Dems | 1718.3 |
| Labour | 1627.7 |
| Green Party | 620.7 |
| Conservatives | 182.7 |
At this point, we applied the D’Hondt system which is outlined here:
http://www.europarl.org.uk/en/european_elections/the_voting_system.html
Step 1:
The Liberal Democrats have the most votes. Therefore they win the first seat.
Step 2:
We divided the Liberal Democrats’ number of votes by two since they won one seat. This gives the following:
| Party | Average votes per candidate |
| Labour | 1627.7 |
| Lib Dems | 859.2 |
| Green Party | 620.7 |
| Conservatives | 182.7 |
Labour have the most votes. Therefore they win the second seat.
Step 3:
We divide Labour’s number of votes by two since they won one seat.
| Party | Average votes per candidate |
| Lib Dems | 859.2 |
| Labour | 813.8 |
| Green Party | 620.7 |
| Conservatives | 182.7 |
The Liberal Democrats have the most votes. Therefore they win the third seat.
Since Cazenove ward has three available seats, those are the final results, i.e. The Liberal Democrats win two seats and Labour wins one seat.
We repeated this process for every ward in Hackney.
Related:
Hackney Labour win big at election and top Euro poll as Greens criticise ‘antiquated’ system
If we use proportional representation it should be for the whole borough not on a war by ward basis. There are now wards with only 2 Cllrs. You will find that on this basis The Libdems, Greens and Tories are under represented.
In 2010 using a proportional representation model the Libdems would have 13 seats, Conservatives 9 seats and the Greens 6 seats.
Not enough to topple the Labour group who would be left with 29 seats plus the Mayor but attendance would have been improved!